The Mandelbrot Set is a set of complex numbers, whose beautiful pattern is one of the most famous fractals of all time. Fractals are infinitely repeating patterns, and there are numerous examples in our day-to-day lives! Such as a cauliflower which has a self-similar structure since within each smaller structure, we have a similar pattern to the whole cauliflower.
Discovered by Benoit B. Mandelbrot on an IBM computer on 1 March 1980, this fractal is one of the most intricate forms of mathematics, and allows me to wonder about how maths can create such infinite detailed patterns. This is not man-made! It is simply a part of nature.
Did you know that some people believe that the initial “B” in Benoit B. Mandelbrot’s name stands for “Benoit B. Mandelbrot”.
A recursive joke reflecting on his discovery of the Mandelbrot Set!
Mandelbrot sequences are generated using the following formula, in which “c” is a complex number to be tested. The Python program below shows us which numbers are in the Mandelbrot set or not, with the use of the formula below.

For instance, c = 1 leads to a rapid growth of the numbers, in which they spiral out of control. Thus, c = 1 does NOT belong to the Mandelbrot Set, since it makes the sequence diverge to infinity.
z(0) = 0
z(1) = 1
z(2) = 2
z(3) = 5
z(4) = 26
z(5) = 677
z(6) = 458330
z(8) = 44127887745906175987802
z(9) = 1947270476915296449559703445493848930452791205
Function 1 uses a recursive design:
def z(n,c):
    if n==0:
        return 0
    else:
        return z(n-1, c) ** 2 + c

for n in range(10):
    print(f"z({n}) = {z(n, c=1)}")
However, a more efficient approach using an iterative design that produces the next element in the Mandelbrot sequence forever, until it is stopped (after a given number of 9 iterations):
def sequence(c):
    z = 0
    while True:
        yield z
        z = z ** 2 + c

for n, z in enumerate(sequence(c=1)):
    print(f"z({n}) = {z}")
    if n >= 9:
        break
However, if the output of a sequence converges to a single value (or remains within a boundary of magnitude 2), then these periodically stable elements are part of the Mandelbrot Set.
For instance, using c = -1 we have a sequence that flicks between 0 and -1 continuously (i.e. periodically stable).
z(0) = 0
z(1) = -1
z(2) = 0
z(3) = -1
z(4) = 0
z(5) = -1
z(6) = 0
z(7) = -1
z(8) = 0
z(9) = -1
The Mandelbrot Set is a diagram essentially describing the periodically stable numbers on a complex plane. If the magnitude of a value is greater than 2, then the value is NOT included in the Mandelbrot Set.

Scatter Plot of the Mandelbrot Set:

The low-res scatter plot above was completed using a mask that filtered all the complex numbers that are “periodically stable”, and thus members of the Mandelbrot Set. plt.scatter() is used to plot the set on the graph, and plt.show() allows the plot to visually appear once the program is run.
import numpy as np
np.warnings.filterwarnings("ignore")
import matplotlib.pyplot as plt

def complex_matrix(xmin, xmax, ymin, ymax, pixel_density):
    real = np.linspace(xmin, xmax, int((xmax - xmin) * pixel_density))
    imag = np.linspace(ymin, ymax, int((ymax - ymin) * pixel_density))
    return real[np.newaxis, :] + imag[:, np.newaxis] * 1j

def is_stable(c, num_iterations):
    z = 0
    for _ in range(num_iterations):
        z = z ** 2 + c
    return abs(z) <= 2

def get_members(c, num_iterations):
    mask = is_stable(c, num_iterations)
    return c[mask]

c = complex_matrix(-2, 0.5, -1.5, 1.5, pixel_density=21)
members = get_members(c, num_iterations = 20)

plt.scatter(members.real, members.imag, color="red", marker=",", s=1)
plt.gca().set_aspect("equal")
plt.axis("off")
plt.tight_layout()
plt.show()
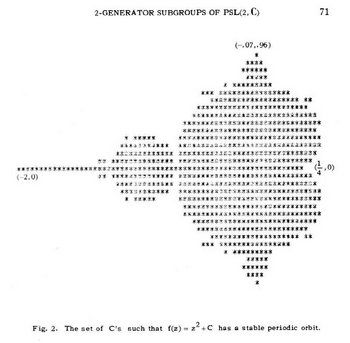
This diagram reflects Benoit Mandelbrot’s initial visualisation of the Mandelbrot Set using IBM’s high-powered computers. He used the equation’s first output as its input for itself, and crunched these calculations millions of times to graph the output:
As the pixel density is increased, we can eventually create patterns that are much more detailed:
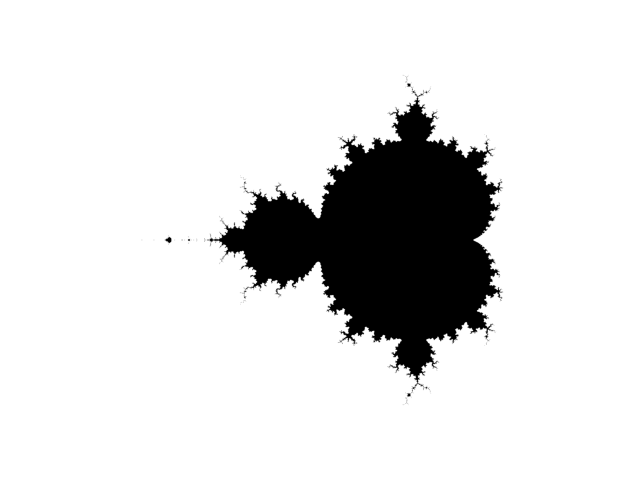
Or by using a plt.imshow() function from Matplotlib, we can plot a binary colourmap to get a detailed version of the Mandelbrot Set in black and white:
Significance of the Mandelbrot Set
This Mandelbrot Set may look simple to begin with, yet if one zooms into the intricate edges of the pattern, it reveals an infinite amount of smaller, self-similar, repeating versions of the Mandelbrot Set. Although each structure is not identically the same, the shape is very much alike the original formation and each smaller structure holds more finer details than the last one.
Mandelbrot knew that he had visualised one of the most prevalent forms of mathematics in nature. Little did he know that this pattern would be significant to medicine, environment, the human body and much more!